
Are TTC fares still the priciest in North America?
Continuing a series that started two years ago, and was revisited last year, it's time once again to see how the TTC compares to its peers when it comes to the cost of riding public transit. Based on those past studies, the Red Rocket was judged the most expensive transit system in any big Canadian or American city that uses a single fare zone. The year 2014 has brought yet another TTC fare increase, so has Toronto retained its unwanted crown?
Cities don't exist in a vacuum. Although they all have their quirks, many large North American cities with integrated bus and rail transit lines have more similarities than differences. Fiscal pressures, strikes, over-budget construction projects -- these are all hardly unique to Toronto. Neither is expensive subway expansion.
In any case, smart cities everywhere learn from each other. Nearly every large city in North America now has a smartcard, and more every year are adopting timed faresthat allow stopovers and return trips within a certain time window rather than the traditional one-way transfers. It's not entirely unreasonable to expect that fares for large systems should exist in a fairly narrow and somewhat comparable band -- and they do.
But every year fares change in at least some of the 29 cities studied. What happened in 2013? While Toronto suffered/enjoyed a year of record ridership, many cities wrestled with the lingering effects of the recession on their budgets. Some new tricks were used to balance the books, such as requiring a fee for fare media.
In Chicago, the base fare was held at $2.25 but to enter a subway station you must now use a smartcard, and a disposable one-trip smartcard will set you back $3 (the $2.25 fare plus an assumed 25 cent transfer and a 50 cent card fee). On the whole, fares were for the most part held stable, with the cost of a monthly pass rising only 3% across the 29-city data set. (Philly, Miami and Phoenix notably had increases over 10%). Cash fares increased a little more. So where does that leave the TTC compared to its peers as 2014 rolls in?
First, a little history. When the Yonge subway opened in 1954, the TTC cash fare was 15 cents, or 10 cents if you bought tickets in bulk. In today's dollars that would be $1.30 cash, 87 cents for tickets. (The 2014 fare is $3 cash, $2.70 cents for tickets - more than twice as much). Compared to its peers back then, the TTC was very competitive on cost as cities like New York, Boston and Chicago typically charged 15 to 20 cents per ride (the US and Canadian dollar were at par in the 1950s). But as funding for public transit systems waxed and waned, the TTC began a slow slide towards the expensive end of the spectrum.
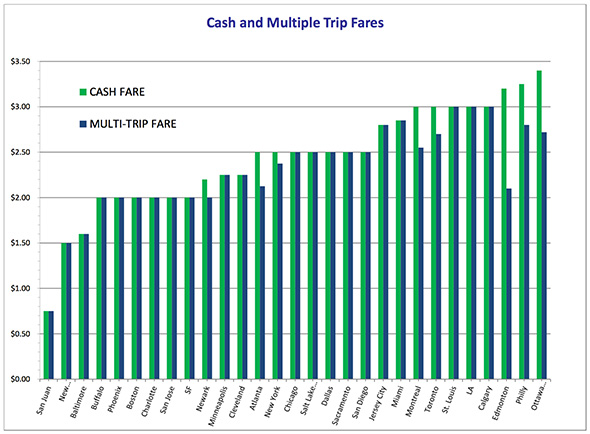
Back to 2014. Toronto is no longer the most costly when it comes to occasional users, as a handful of cities are now slightly more expensive for infrequent riders. A C-Train ticket in Calgary costs more ($3) than dropping a token ($2.70) into a TTC turnstile. Montreal has now caught up to Toronto for cash fares ($3), while Ottawa ($3.40) and Edmonton ($3.20) cost quite a bit more -- though all three cities have equivalent or lower token (multiple-trip) prices.
Even a few American cities (St. Louis, Philly, LA) are now pricier than the TTC if one includes the price of a transfer (see notes below). Compared to the mean average of the entire 29-city data set (including Toronto), the TTC is 23% more expensive for cash fares and 17% more expensive for frequent riders (i.e. people who buy tickets or tokens in quantity). The Red Rocket is still very pricey for these kinds of users, if no longer quite the priciest.
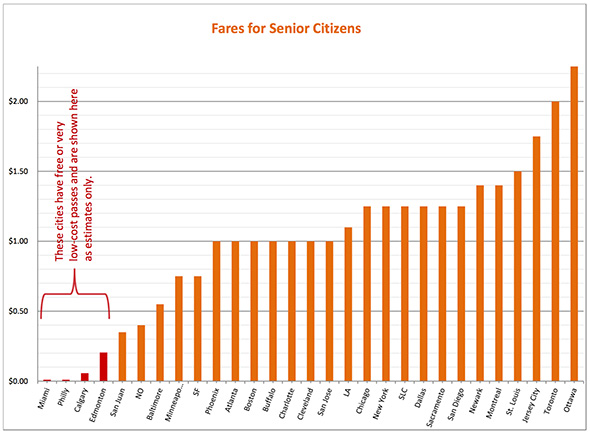
Senior fares are another matter. This specific kind of discounted fare was used as the metric for comparing reduced fare types, and for seniors it remains far more expensive to ride transit Toronto than all other cities except Ottawa. And that city offers a $40 monthly senior's pass and free Wednesdays to compensate. Other cities that have expensive adult fares such as Calgary and Edmonton have very progressive fares for seniors -- as low as $15 per year. Philadelphia and Miami let seniors ride free, all the time. But in Toronto, where government subsidies are low, seniors and other discounted riders pay a steep price.
The Metropass is where the TTC really stands out from the pack, as the pass is now a staggering 65% more costly than the mean cost of a monthly pass in the 29-city dataset. Even if just compared to eight big cities with fairly comparable (i.e. subway-heavy, high ridership) transit networks -- New York, Boston, SF, Philadelphia, LA, Montreal, Atlanta, Chicago -- the cost of a Metropass is still 55% more than the average cost of passes in those cities. Narrow those peers to just Chicago and New York and the TTC pass is still 26% more each month.
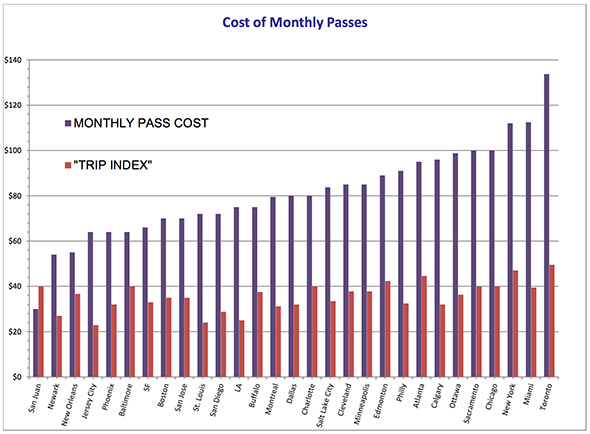
What makes matters even worse is that Toronto seems to be uniquely discouraging the purchase of a monthly pass in first place. Under the recent fare hike a rider must now take 49.5 rides per trip to make the monthly pass worthwhile ($133.75/$2.70 = 49.53). This equates to having to commute all 22 work days in a month, never taking vacation or being sick, not even taking off Canada Day or Christmas or other statutory holidays, and then travel eight more times in the evening or on weekends. No other city has such a high index - the average for the entire 29-city set is only 36 trips.
The only other city to blow past the 44 trip index (2x per working day) is New York (47), where levels of car ownership are low and a leading 56% of people take transit to work. (Toronto and Montreal, by comparison, are around a 22% transit share). The cost of the Metropass, and its cost relative to the base fare, seems to be out of line not only with other cities but with basic transportation policy for encouraging the use of public transit, and people are starting to notice.
On the basis of the sky-high cost of the Metropass, the very high senior fares and the still top-tier cash and token fares, I believe it is still appropriate to say that the TTC remains the most expensive of its big-city, single-fare-zone public transit peers. With additional revenue streams still a matter of great controversy and all political capital consumed by never-ending expansion debates (when not trying to throw streetcars into Lake Ontario), this situation may not change for some time. Your next stop on a TTC vehicle might as well be an ATM.
Mind the (fiscal) gap.
-----
The Fine Print
- This comparison is of North American transit systems but does not include Mexico, since labour costs, income levels, and other parameters there are quite different than the US or Canada. This is evident given the 41 cent fare of the Mexico City Metro (which was a 66% hike over the previous fare!)
-The dataset consists of 29 big-city single-fare integrated public transit systems. Cities without subway or light rail, such as Winnipeg, are not included. Ottawa is included on the strength of it's heavy-infrastructure BRT, the Transitway.
- Very significantly, this set does not include any zone-based transit systems such as Washington DC, Pittsburgh, Houston, Denver, Portland, Seattle or Vancouver. These are apples-to-oranges when compared to single fare-zone systems because while they might be considerably more expensive for distant riders they are often less expensive for short rides in a single zone. Vancouver and Washington DC are particularly costly, though a monthly pass within Vancouver is only $91 and a short Metrorail ride can cost as little as $1.70 off-peak. Perhaps in a future post I will try to level one of these vs Toronto on a dollar-per-km basis, but for the purposes of this study they are excluded.
- The cash fare, or base fare, is the standard one-time single-trip fare, used mostly by tourists and infrequent users and traditionally paid in cash (think coins in the farebox when boarding the bus). It is the easiest to compare among transit systems but also the least relevant to commuters and quickly falling out of use in the era of smartcards.
- More interesting is what I call the "Multiple-trip Fare." This is meant to reflect the lowest possible cost for a paid trip, i.e. what a frequent pay-per-ride user would pay because they buy bulk tickets or tokens or get a smart-card discount. Some cities offer a lower price for frequent users using these structures; some do not, in which case the multiple trip fare matches the cash fare.
- For the individual fares, transfers had to be equalized. Most systems offer one or more free transfers, but some (New Orleans, Newark, St. Louis, Chicago, Jersey City, LA, Miami, Philly) still require paid transfers costing 25 cents to $1.50 every time you change buses or trains. I have included the cost of one transfer in their cash fare, multiple trip fare and senior fare numbers, even though this spikes the cost significantly, up to 100% in the case of LA. I believe it is realistic since few people live on the exact bus or rail line that takes them from home to work. But do take the base fare costs for these cities with a grain of salt since they would indeed be much lower if a transfer was not needed.
- Day and Weekly passes are too varied to compare, and not all cities offer all formats, but Monthly passes are a common standard. While these do differ between cities in terms of whether they are transferrable, 30 or 31 days, or when the month actually starts, they are all considered equivalent for the purpose of this study. The unique Metropass Discount Program, which slightly lowers the cost of a TTC metropass for a 12-month subscription, is ignored here as it is effectively an annual pass and not a monthly pass; the regular Metropass is used in the study.
- Also on the Monthly chart you will see what I am calling the Trip Index, which is the cost of a monthly pass divided by the Multiple Trip fare. It is the number of trips one must take before a monthly pass becomes a better value than using tokens/pay-per-ride smartcards. Keep in mind when using the Trip Index that the average month has about 22 working days, not including holidays.
- Student fares are far too varied in terms of format and age limits to easily compare, but all cities offer some sort of "Senior Fare" that is more easily levelled. Note that I used the cash fare for the Senior category and not any discounted multiple trip fare. (In Toronto, for example, this would lower the $2 fare to $1.85). Miami, Philadelphia, Calgary and Edmonton have an usual setup where seniors pay as little as zero to $54 for an annual pass, so I arbitrarily set their senior per-trip cost at very low figures. This might not be fair when comparing to cash fares in other systems but I felt it was important to note their progressive policies towards seniors as an example of how systems manage discounts for certain groups of riders.
- Certain cities (Ottawa, Edmonton, Calgary, Dallas, Minneapolis, St. Louis, San Francisco) use a 90 minute or 2-hour fare that allows stopovers and transfers in either direction. These are effectively short-term passes that add tremendous value for certain kinds of trips - for example, to run a short errand and return on a single fare cuts the effective cost of transit in half. However, they are not used by commuters going one-way to work so I ignore them here.
- Two cities in the Base Fare chart (Calgary and Salt Lake City) still have a Free Fare zone. These also add value for some users but are slowly disappearing (Seattle and Portland removed theirs in 2012) and ignored in this study.
- Minneapolis and Dallas offer reduced fares outside of rush hour. While a boon to livability in a vibrant city, these types of fares are not used by commuters and are ignored here.
- Where different prices for bus vs subway do still exist, as in Boston, Chicago or St. Louis, the rail fare was used. For Ottawa the bus price was used as this city is unique in having a full BRT trunk line. (The small demonstration rail line is actually less expensive to ride but carries only 2% of daily ridership and is therefore ignored).
- This comparison is about major cities with trunk rail lines. No suburban bus systems were included, nor should they be. Different animals. But suburban systems do tend to take their pricing cues from their big-city cousins because they are subject to similar funding and expense parameters. Just as the TTC may be the most expensive big-city system, it is very likely that York Region Transit is the most expensive suburban system on the continent with its $4 cash fares, $3.33 multiple trip fares, $4 senior fares and $132 monthly passes. Ontario clearly has a growing issue with costly public transit, urban and suburban.
- Exchange rate in this comparison was assumed to be $1 US = $1 Cdn. This has been reasonably true over the past few years and a difference of a few cents would not grossly affect the results of the study. This may be revisited next year if the Canadian dollar begins to slide.
Guest contribution by Larry Green / Photo by Tom Ryaboi


