How many cyclists ride in downtown Toronto per day?
When discussions about the merits of installing bike lanes on downtown Toronto streets come up, it'd be pretty nice to have some go-to stats on the actual number of cyclists who ride in the city on a daily basis. Well, thanks to a study conducted by the City of Toronto conducted in September of this year, such information has become available.
It's limited to the core of the city -- the boundaries (or "screenlines") were Bloor, Spadina, Queens Quay and Jarvis -- but the data is fascinating none the less. In addition to stats on total ridership, the survey tracks the male/female breakdown of riders, where and when cyclist activity is concentrated, helmet use, instances of sidewalk riding and other specific information.
Here are some of the highlights:
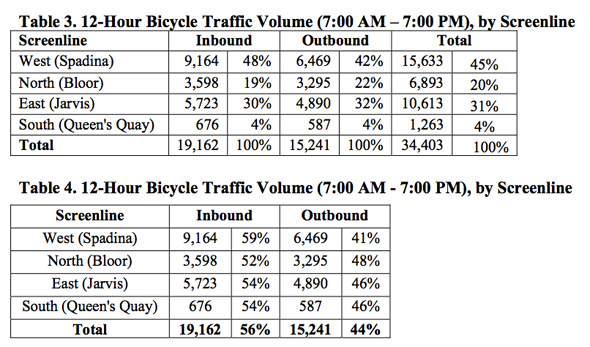
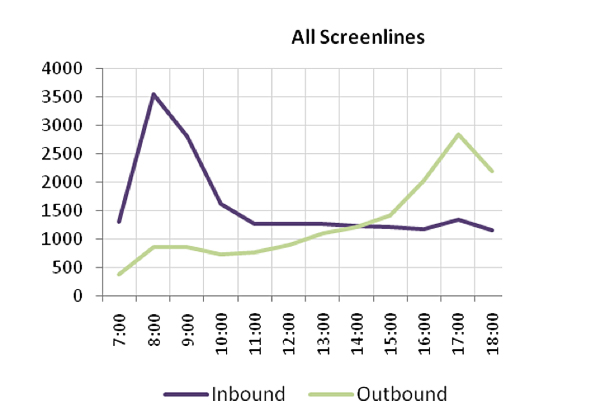
- Between the hours of 7:00 AM and 7:00 PM on a typical weekday in September 2010, 19,162 cyclists entered Toronto's downtown core, and 15,241exited the core.
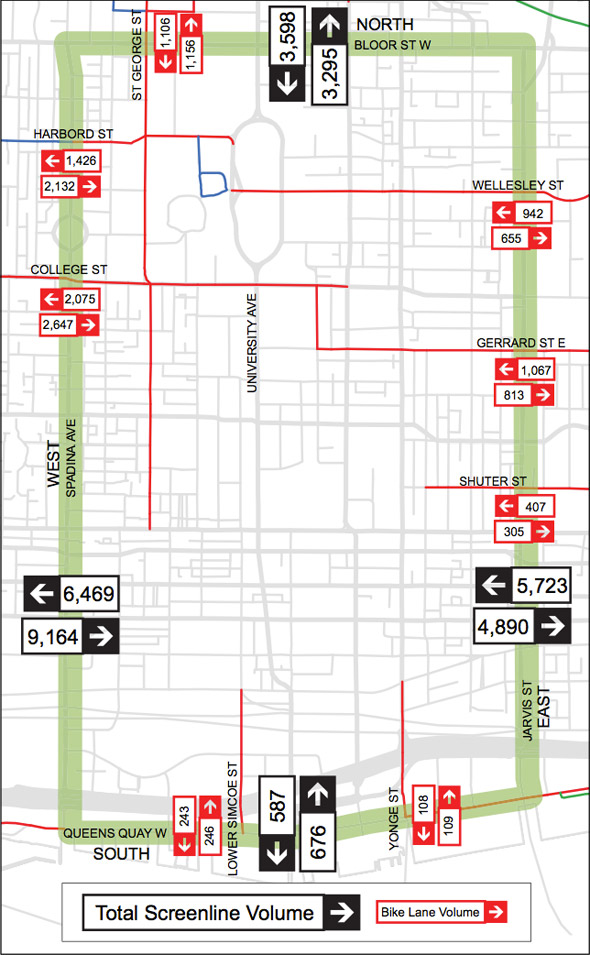
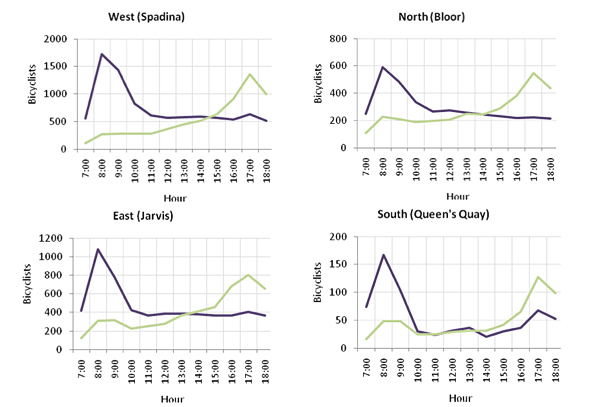
- The western screenline at Spadina Avenue had the highest bicycle volumes, carrying 45% of all cyclists travelling to and from the core.
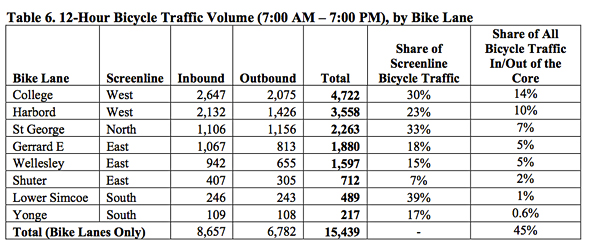
- The College Street bike lane carries by far the greatest volume of cyclists of any road or bike lane along a screenline, with 14% of all cyclists travelling to and from downtown.
- The distribution of cyclists indicates they prefer arterial roads (over local or collector roads), and roads with bike lanes.
- Bicycle traffic in the core follows a traditional peak period pattern - with an inbound peak in the morning (pre 7:00 AM to 10:30 AM), and an outbound peak in the afternoon and early evening (3:30 PM to past 7:00 PM).
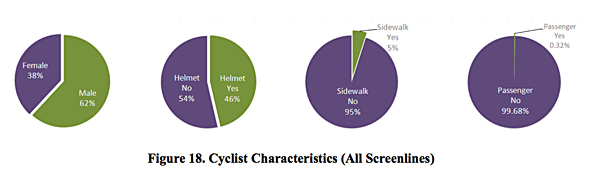
- The majority (62%) of cyclists were male, wore a helmet (54%), and rode on the street rather than on the sidewalk (95%). Very few (0.32%) of counted cyclists were passengers (e.g. in a child seat or trailer).
And here are some maps, charts, and graphs with more information:
The screenlines / study area
Traffic breakdowns
By graph
Entering and Exiting the core by hour
Cyclist characteristics
Read the full report here (PDF).
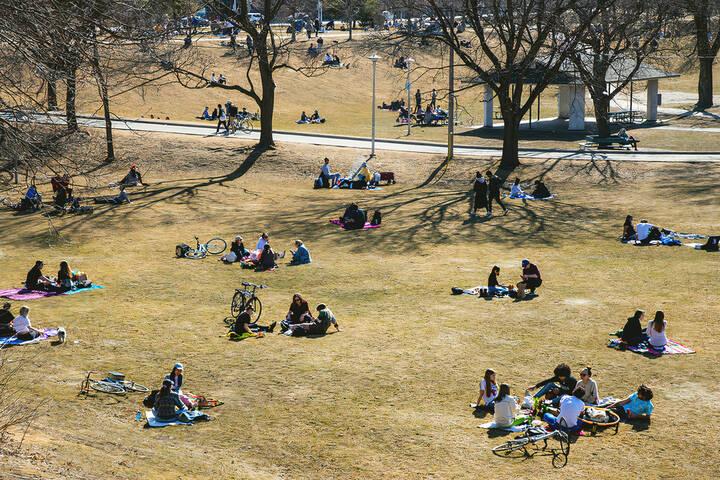
Photo by DdotG in the blogTO Flickr pool.
Latest Videos
Latest Videos
Join the conversation Load comments